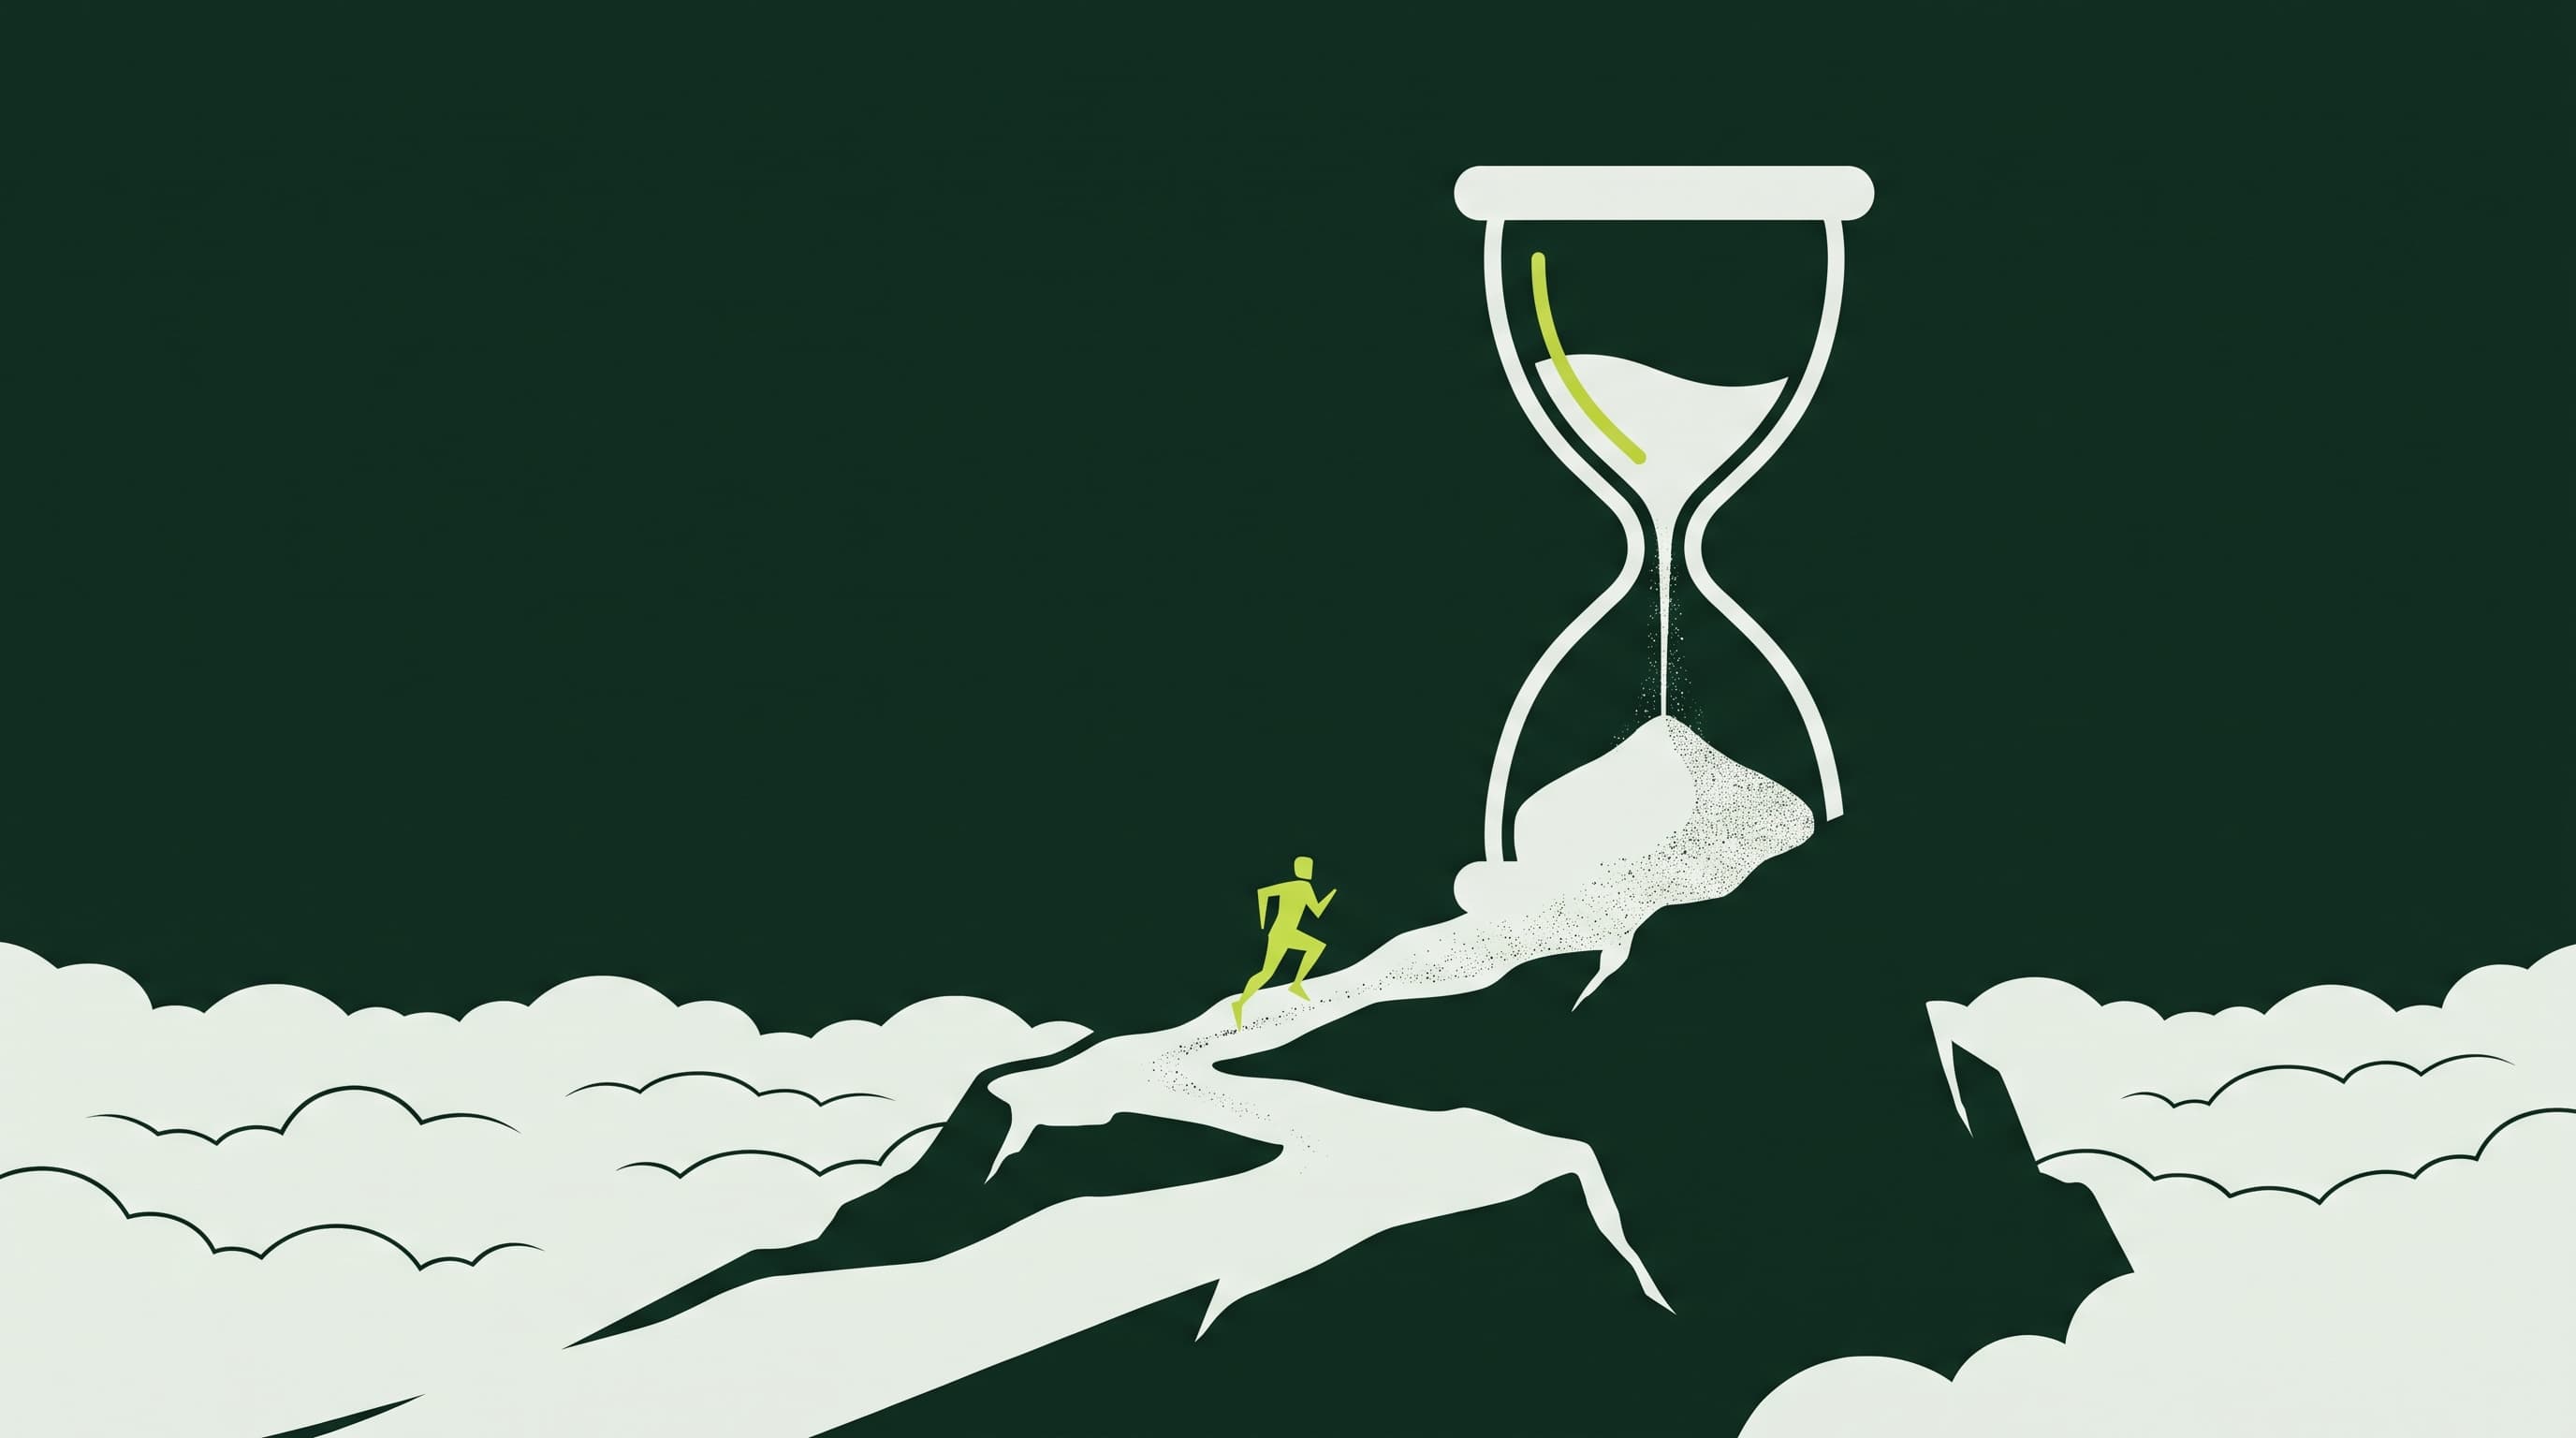

The 75th-percentile male marathon finisher, the runner who crosses the line behind three-quarters of the field, runs about 12 minutes slower at 17.4°C than he does at his own best temperature, ten degrees cooler. Warm the air another ten degrees, to 27.4°C, and his bill climbs to 57 minutes. The fastest one percent of men, racing at 23.8°C, twenty degrees above their own far cooler optimum, lose under 10 minutes. Same race, same day, and each runner pays a different price for the identical rise in the thermometer.
Those numbers come from 1,791,972 individual marathon finishes across Berlin, Boston, Chicago, London, New York and Paris between 2001 and 2010, 60 races in total, published by El Helou and colleagues in PLOS ONE. For every race, the researchers averaged air temperature over the first four hours after the gun and matched it against each finisher's speed. One detail changes how the whole study should be read: each group of runners is measured against its own optimal temperature rather than one shared across the field. The fastest women's best speed arrives around 9.9°C; the fastest men's, closer to 3.8°C. Every optimum in the study falls somewhere in that range, cooler than most runners would guess counts as ideal race weather.
A curve, not a slope
El Helou's team fit the relationship between temperature and speed as a curve that rises to a peak at each group's own optimum and bends away in both directions, rather than a straight decline. That shape matters, because it means a marathon a few degrees on either side of the optimum barely costs anything, while the same few degrees further out cost far more than a straight line would predict.
Twenty degrees above his own optimum, the fastest one percent of men has lost 6.00 percent of his peak speed. Twenty degrees above his own optimum, the 75th-percentile finisher has lost 21.42 percent. Both men ran the identical number of degrees above their own best conditions and paid entirely different prices for it. Percentage of speed lost and percentage of time lost move at different rates, since time is distance divided by speed.
A separate dataset of 140 race-years across Boston, New York, Twin Cities and four other marathons found the same progressive slowing, worse for slower runners than for faster ones. A study of 1,280,557 New York City Marathon finishers from 1970 to 2019 found the whole field losing close to 7.7 minutes in the hottest third of race days, against roughly 1.9 minutes for the top ten finishers, on the same course in the same conditions.
Why the same ten degrees costs different runners different amounts
Air temperature outranked humidity, dew point, barometric pressure and even measured air pollutants as a predictor of marathon performance, at every performance level, in both sexes, in El Helou's data. Humidity came second.
Two mechanisms explain why heat bites harder as air temperature rises. The first is physical rather than physiological: a 2024 study in npj Climate and Atmospheric Science followed elite athletes across their own events, rather than one race across shifting fields of runners, isolating the weather effect from who happened to show up. Above 15°C, performance worsened by 0.56 minutes per additional degree on average, 0.39 minutes for men and 0.71 for women. More than half of that effect traced to warmer air holding less oxygen per breath: heat expands air and raises its vapor pressure, lowering the oxygen available in each lungful before fatigue or dehydration play any part. Under a high-emissions warming scenario, the study projects elite marathoners losing 2.51 minutes by the end of the century relative to 2020; under an intermediate scenario, 1.06 minutes.
The second mechanism is about pacing, and it runs against the instinct that slower runners blow up harder in the heat. A study of three Japanese women's championship marathons across 62 race-years compared each runner's final five kilometers against her first five, in races run between 5°C and 10°C against races run between 15.1°C and 21°C. The race winner sped up by 22 seconds late in cool races and slowed by 24 seconds late in warm ones. The 25th-place finisher slowed from 90 seconds late in cool races to 191 seconds in warm ones. The 100th-place finisher slowed by roughly 199 seconds in both conditions, no change at all. Heat exaggerates the late-race fade of the runners near the front far more than it does for the runners further back. The extra time slower runners lose to heat comes from running slower for the entire 42.195 kilometers, rather than from a harder collapse near the finish.
Haile Gebrselassie's Berlin results carry the same story in miniature: both of his world records there came at the coolest temperatures he raced the course in, 14°C and 13°C. He won the same race, without breaking the record, at 18°C and 22°C in the two warmer years.
Which race is the gamble
Every marathon has a probability, in any given year, of landing inside a runner's optimal window. Climate Central's October 2025 report, led by analyst Andy Pershing, fit a curve to El Helou's own speed data and defined the "optimal window" as the range within 99.5 percent of a group's peak speed. For a recreational runner, that window sits between roughly 3°C and 11°C, centered near 6°C for men and 7°C for women. The report then blended observations with climate models to compute how often a race day's average temperature, the mean of that day's high and low, falls inside that window.
Tokyo tops that ranking for 2025: a 79 percent chance its race day landed inside the recreational men's window, 81 percent for recreational women. Honolulu, Rio de Janeiro, Dubai, Bangkok, Mumbai and Singapore sit at zero. Berlin, held every September, gives recreational men just 4 percent odds despite its Abbott World Marathon Majors status. That gap between a marathon's prestige and its climate is worth weighing before signing up: 42cal's race directory makes it possible to browse marathons by country and pick a season with better odds, rather than choosing on reputation alone.
The 2025 editions of Tokyo and Berlin already show the trend in motion. Tokyo runners experienced an average temperature of 15.2°C, about 8.2°C warmer than normal, a level of warmth the report's Climate Shift Index system found human-caused climate change had made three times more likely. Berlin runners experienced 20.7°C, 6.7°C above normal, twice as likely under the same measure. Of 221 races analyzed, 190, 86 percent, are projected to see declining odds of optimal conditions by 2045 for recreational or elite runners, including all seven Majors.
Some races are trying to outrun the trend by starting earlier. An earlier start would lift London's elite men from 17 percent odds in 2045 to 61 percent, and Tokyo's from 57 to 88. But elite women's optimal temperature runs warmer than men's, so the same fix cuts the other way for them: an earlier Tokyo start would drop elite women's odds by 41 points in 2045, while the same change would help them most in Berlin. No single start time solves the problem for every runner on the same course.
Where it turns dangerous
Race organizers do not watch a simple thermometer on race morning. They watch wet bulb globe temperature, a single reading that folds together air temperature, humidity, wind and direct sun exposure. A 2010 study built to define when marathon heat turns dangerous, examining decades of one race's own weather and medical records, found finish-line medical encounters and on-course dropouts begin rising once wet bulb globe temperature passes 13°C. The American College of Sports Medicine sets its general cutoff for competition at 28°C on that scale, a limit researchers have noted may not reflect the real safety margin for unacclimatized, non-elite runners.
The Twin Cities Marathon supplied the cleanest baseline of all: across 1983 to 1994, when the race started at an average temperature of 5°C, the rate of medical encounters and dropouts combined, per 1,000 finishers, ran at 23. In races where wet bulb globe temperature climbed into the 20s, that same rate reached 132 at Boston in 2004, 160 at Twin Cities in 2007, and 301 at Rochester, New York in 2008, up to thirteen times the cool-weather baseline. Twin Cities fit twelve years of its own data to a curve solid enough to set policy from: its do-not-start line, 20.5°C wet bulb globe temperature, marks the point where the model crosses 130 unsuccessful starters per 1,000 finishers.
That threshold became real on the morning of October 1, 2023, when organizers cancelled the marathon and its companion ten-mile race by email to roughly 20,000 registered runners at 5:20 a.m., citing an extreme-heat "black flag" warning as the forecast high climbed toward 91°F, breaking an Oct. 1 record of 87°F that had stood since 1897. It was only the second cancellation in the race's 40-year history; the other was 2020, for COVID. A threshold built from Twin Cities' own 2007 crisis ended up cancelling the same race sixteen years later.
Chicago in 2007 shows what happens when a race keeps going past that point. Berhane Adere won the Chicago Marathon in 2006 in 2:20:42, then won it again in 2007, on the same course, in 2:33:49, 13 minutes and 7 seconds slower one year apart. Air temperature that October morning reached a race-record 88°F by 10 a.m., a four-hour average of 25.0°C, the hottest of Chicago's ten years in El Helou's dataset; wet bulb globe temperature started at 22.2°C and rose to 28.9°C by the time officials halted the race three and a half hours in. Of 45,000 registered runners, about 10,000 never started, and 10,934 of those who did start never finished, a 30.74 percent withdrawal rate, the highest of the 60 races. Only 1,363 runners had already crossed the finish line at the moment of cancellation; thousands more kept running past the warnings. The most reliable tally, from that same safety study, puts 185 runners taken to hospital, 66 admitted and 12 in intensive care. One runner, 35-year-old Chad Schieber, died.
Boston deferred rather than cancelled in 2012, offering entrants the option to push their entry to 2013 ahead of a race day that reached the high 80s Fahrenheit. Only 427 of the 22,426 runners who collected their numbers took it. Roughly one in ten of the field received medical treatment, a Boston Globe retrospective found. Winner Wesley Korir crossed in 2:12:40; the year before, on the same course, Geoffrey Mutai had run a tailwind-aided 2:03:02. Boston's weather swings between editions help explain why predicting a qualifying cutoff is so difficult each year: a hot spring can slow an entire qualifying season's times before the cutoff is set.
The extreme case sits at the 2019 World Championships women's marathon in Doha, moved to a midnight start specifically to dodge the heat and still run in 32°C air at 74 percent humidity. Twenty-eight of 68 starters, 41 percent of the field, did not finish, a rate researchers called unprecedented. The field's mean pace fell to 14.82 kilometers per hour, against 15.74 kilometers per hour for a temperate 2017 championship race in London at 19°C. Pacing errors alone, the study's authors concluded, could not explain the failure rate.
Where the data disagrees
Slower runners losing more time to heat than faster ones holds across three independent datasets, but reverses at the very front of the field in one study. A 2020 Frontiers in Psychology analysis of the top 1,000 New York City Marathon finishers each year from 2006 to 2018 sorted those runners into four ability clusters and compared an 8°C wet bulb globe day against a 20°C "do not start" day. The fastest cluster ran 16.89 percent slower between those two conditions. The slowest of the four clusters, still a fast runner by any ordinary measure, ran only 5.44 percent slower, the reverse of the gradient in the 140-race-year dataset and the 1970-2019 New York City cohort. The likely reconciliation: "slowest" inside a study of only the top 1,000 finishers still means fast. The ability gradient looks contested at the sharp end of an elite field, and consistent everywhere else.
One more caution belongs here, because a runner searching this question will hit it within a few results. A widely shared online table gives exact slowdown figures per degree by finish-time bracket, built by taking a study of sub-three-hour finishers and extending its slope onto much slower runners in a straight line. Its own author calls that extrapolation "overly simplistic and probably excessively conservative." The numbers in it were derived by assumption rather than measured.
What a runner does with this
None of this argues for skipping a warm-weather marathon. It argues for knowing which bill applies before race day. A goal time from 42cal's race time predictor implicitly assumes something close to a runner's own optimal weather, the 3°C to 11°C window Climate Central marks out for recreational runners. A forecast that pushes race morning ten or twenty degrees past that window calls for adjusting the goal, rather than defending the original number regardless of conditions. 42cal's course difficulty analyzer accounts for the terrain a course throws at a runner; weather is the variable layered on top, changing year to year on the same course.
Heat is one environmental tax a marathon can charge; elevation is a separate one, and what altitude costs a marathon finisher runs by different rules entirely, worth knowing before choosing between a hot flat course and a cool high one. What heat charges, though, is no longer a guess: a runner can look up the number for their own pace and a course's own history before race morning, rather than finding out on the course itself.